8791 sujets

Développement web côté serveur, CMS

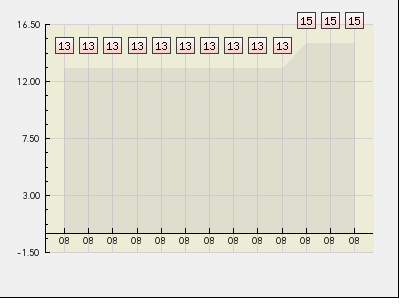
Bonjour , je n'arrive pas a afficher mes x et y avec artichow via cette requette,
Merci de votre aide

<?php
 
require_once "Artichow/BarPlot.class.php";

require_once "../Connections/bookpro.php";
 
$graph = new Graph(550, 400);

$sql = "SELECT date_format(date_on, '%d') as ma_date, date_format(heure,'%H') as mon_heure  FROM cliquetel";
$result = mysql_query( $sql,$bookpro ) or die ( mysql_error() );
 while ($resultat = mysql_fetch_array($result)) 

	  {$values[] = $resultat['ma_date'];}
	  {$values2[] = $resultat['mon_heure'];}
 
 
$plot = new BarPlot($values);
$y = array($values2); 

$plot->setBarGradient(
	new LinearGradient(
		new LightBlue(25),
		new VeryLightOrange(25),
		90
	)
);
 
$plot->setSpace(5, 5, NULL, NULL);
 
$plot->barShadow->setSize(4);
$plot->barShadow->setPosition(Shadow::RIGHT_TOP);
$plot->barShadow->setColor(new Color(180, 180, 180, 10));
$plot->barShadow->smooth(TRUE);
$y =($values2);
$plot->xAxis->setLabelText($y);
$plot->xAxis->label->setFont(new Tuffy(7));
 
$graph->add($plot);
$graph->draw();
 
?>
Smiley langue upload/18489-Capturedec.png
Modifié par outage (08 Feb 2010 - 14:41)
bon ben j'ai trouve,
voici le code pour intégrer des axes x et y avec artichow via une base qui comporte des dates et des heures .
<?php

   require_once "../Artichow/LinePlot.class.php";
   
   require_once "../Connections/bookpro.php";
   
   $graph = new Graph(400, 300);
   $graph->setAntiAliasing(TRUE);
   
   $sql = "SELECT time_format(heure, '%k') as mon_heure FROM cliquetel";
   $result = mysql_query( $sql,$bookpro ) or die ( mysql_error() );
   while ($resultat = mysql_fetch_array($result)) 

	  {$values[] = $resultat['mon_heure'];}
	  
   $sql = "SELECT date_format(date_on,'%d') as ma_date FROM cliquetel";
   $result = mysql_query( $sql,$bookpro ) or die ( mysql_error() );
   while ($resultat = mysql_fetch_array($result)) 
	  {$value[] = $resultat['ma_date'];}

   $plot = new LinePlot($values);
   $plot->setBackgroundColor(new Color(240, 240, 240));
   
   $plot->hideLine(TRUE);
   $plot->setFillColor(new Color(180, 180, 180, 75));
   
   $plot->grid->setBackgroundColor(new Color(235, 235, 180, 60));
   
   $plot->yAxis->setLabelPrecision(2);
   
 
   $plot->xAxis->setLabelText($value);
      
   $plot->setSpace(6, 6, 10, 10);
   
   $plot->mark->setType(Mark::IMAGE);
   
   $plot->label->set($values);
   $plot->label->move(0, -23);
   $plot->label->setBackgroundGradient(
      new LinearGradient(
         new Color(250, 250, 250, 10),
         new Color(255, 200, 200, 30),
         0
      )
   );
   $plot->label->border->setColor(new Color(20, 20, 20, 20));
   $plot->label->setPadding(3, 1, 1, 0);
   
   $graph->add($plot);
   $graph->draw();
   
?>
upload/18489-Capturedec.png
Modifié par outage (08 Feb 2010 - 15:50)